Charts and slides, made once.
A chart builder and a slide-deck builder that share one renderer, so a chart looks the same whether it stands alone or sits inside a panel. Type your numbers in, or paste notes and let an AI assistant turn them into a slide. Nothing ever leaves your computer.
The right chart, not just any chart.
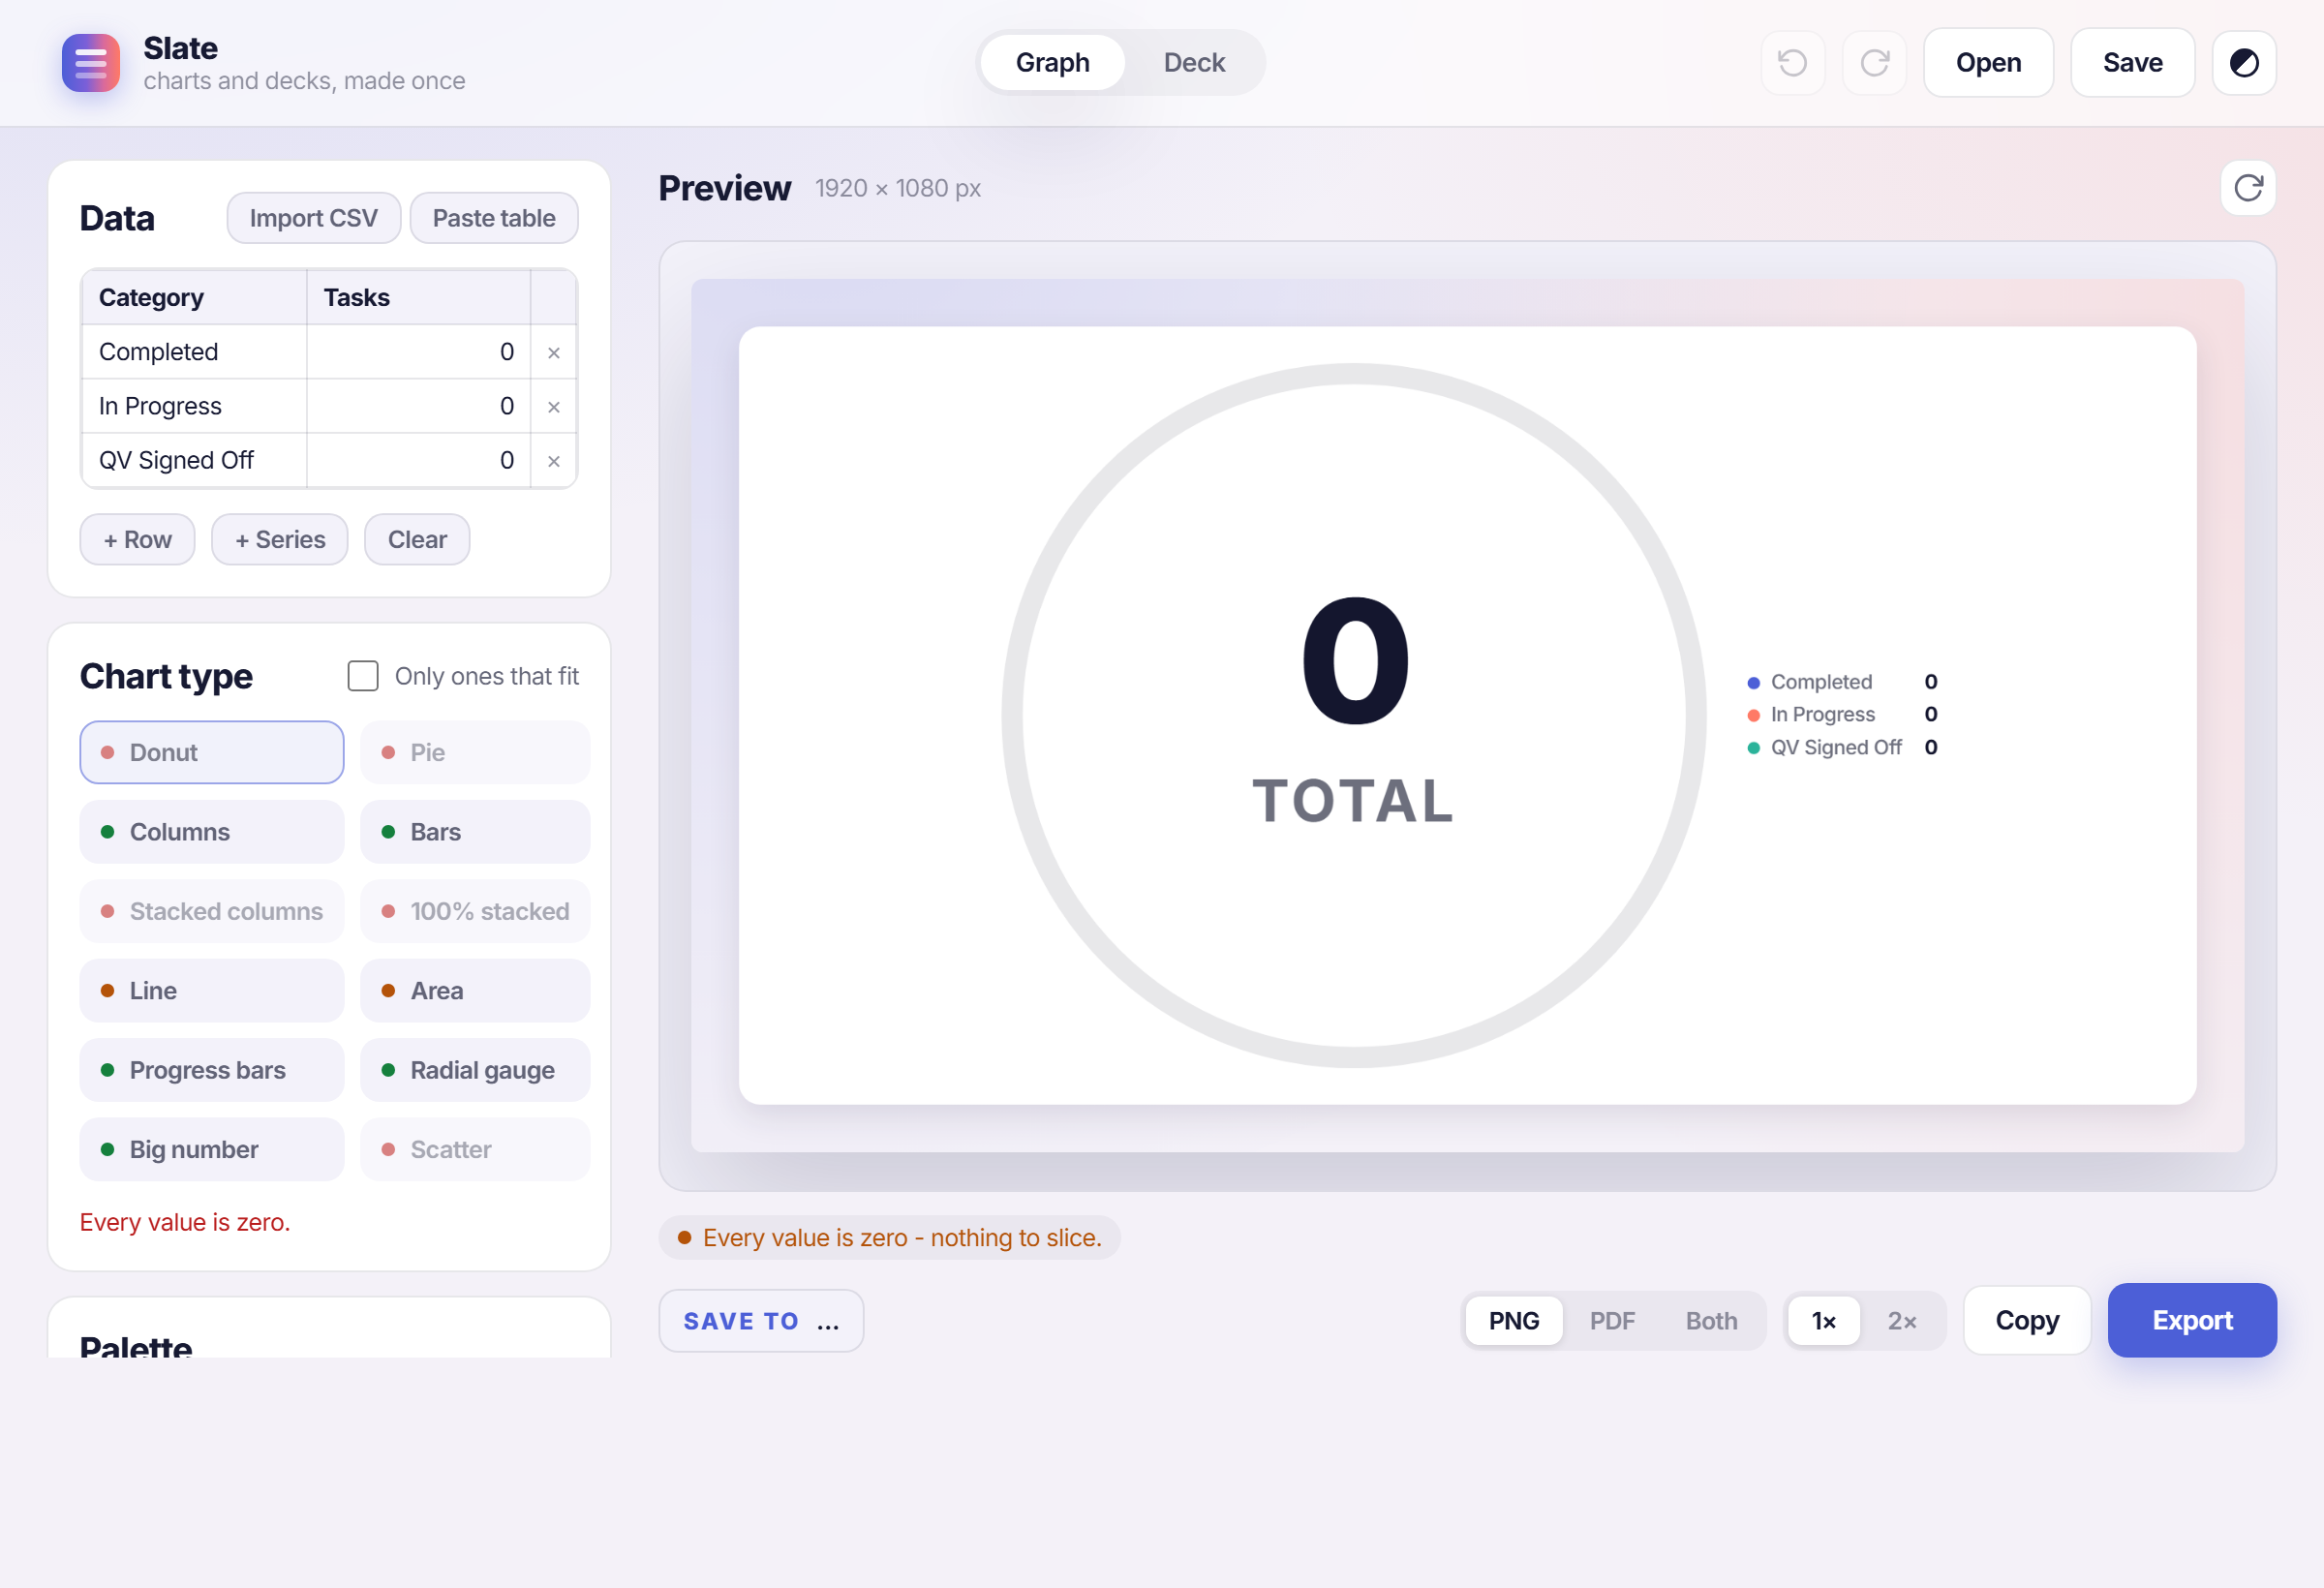
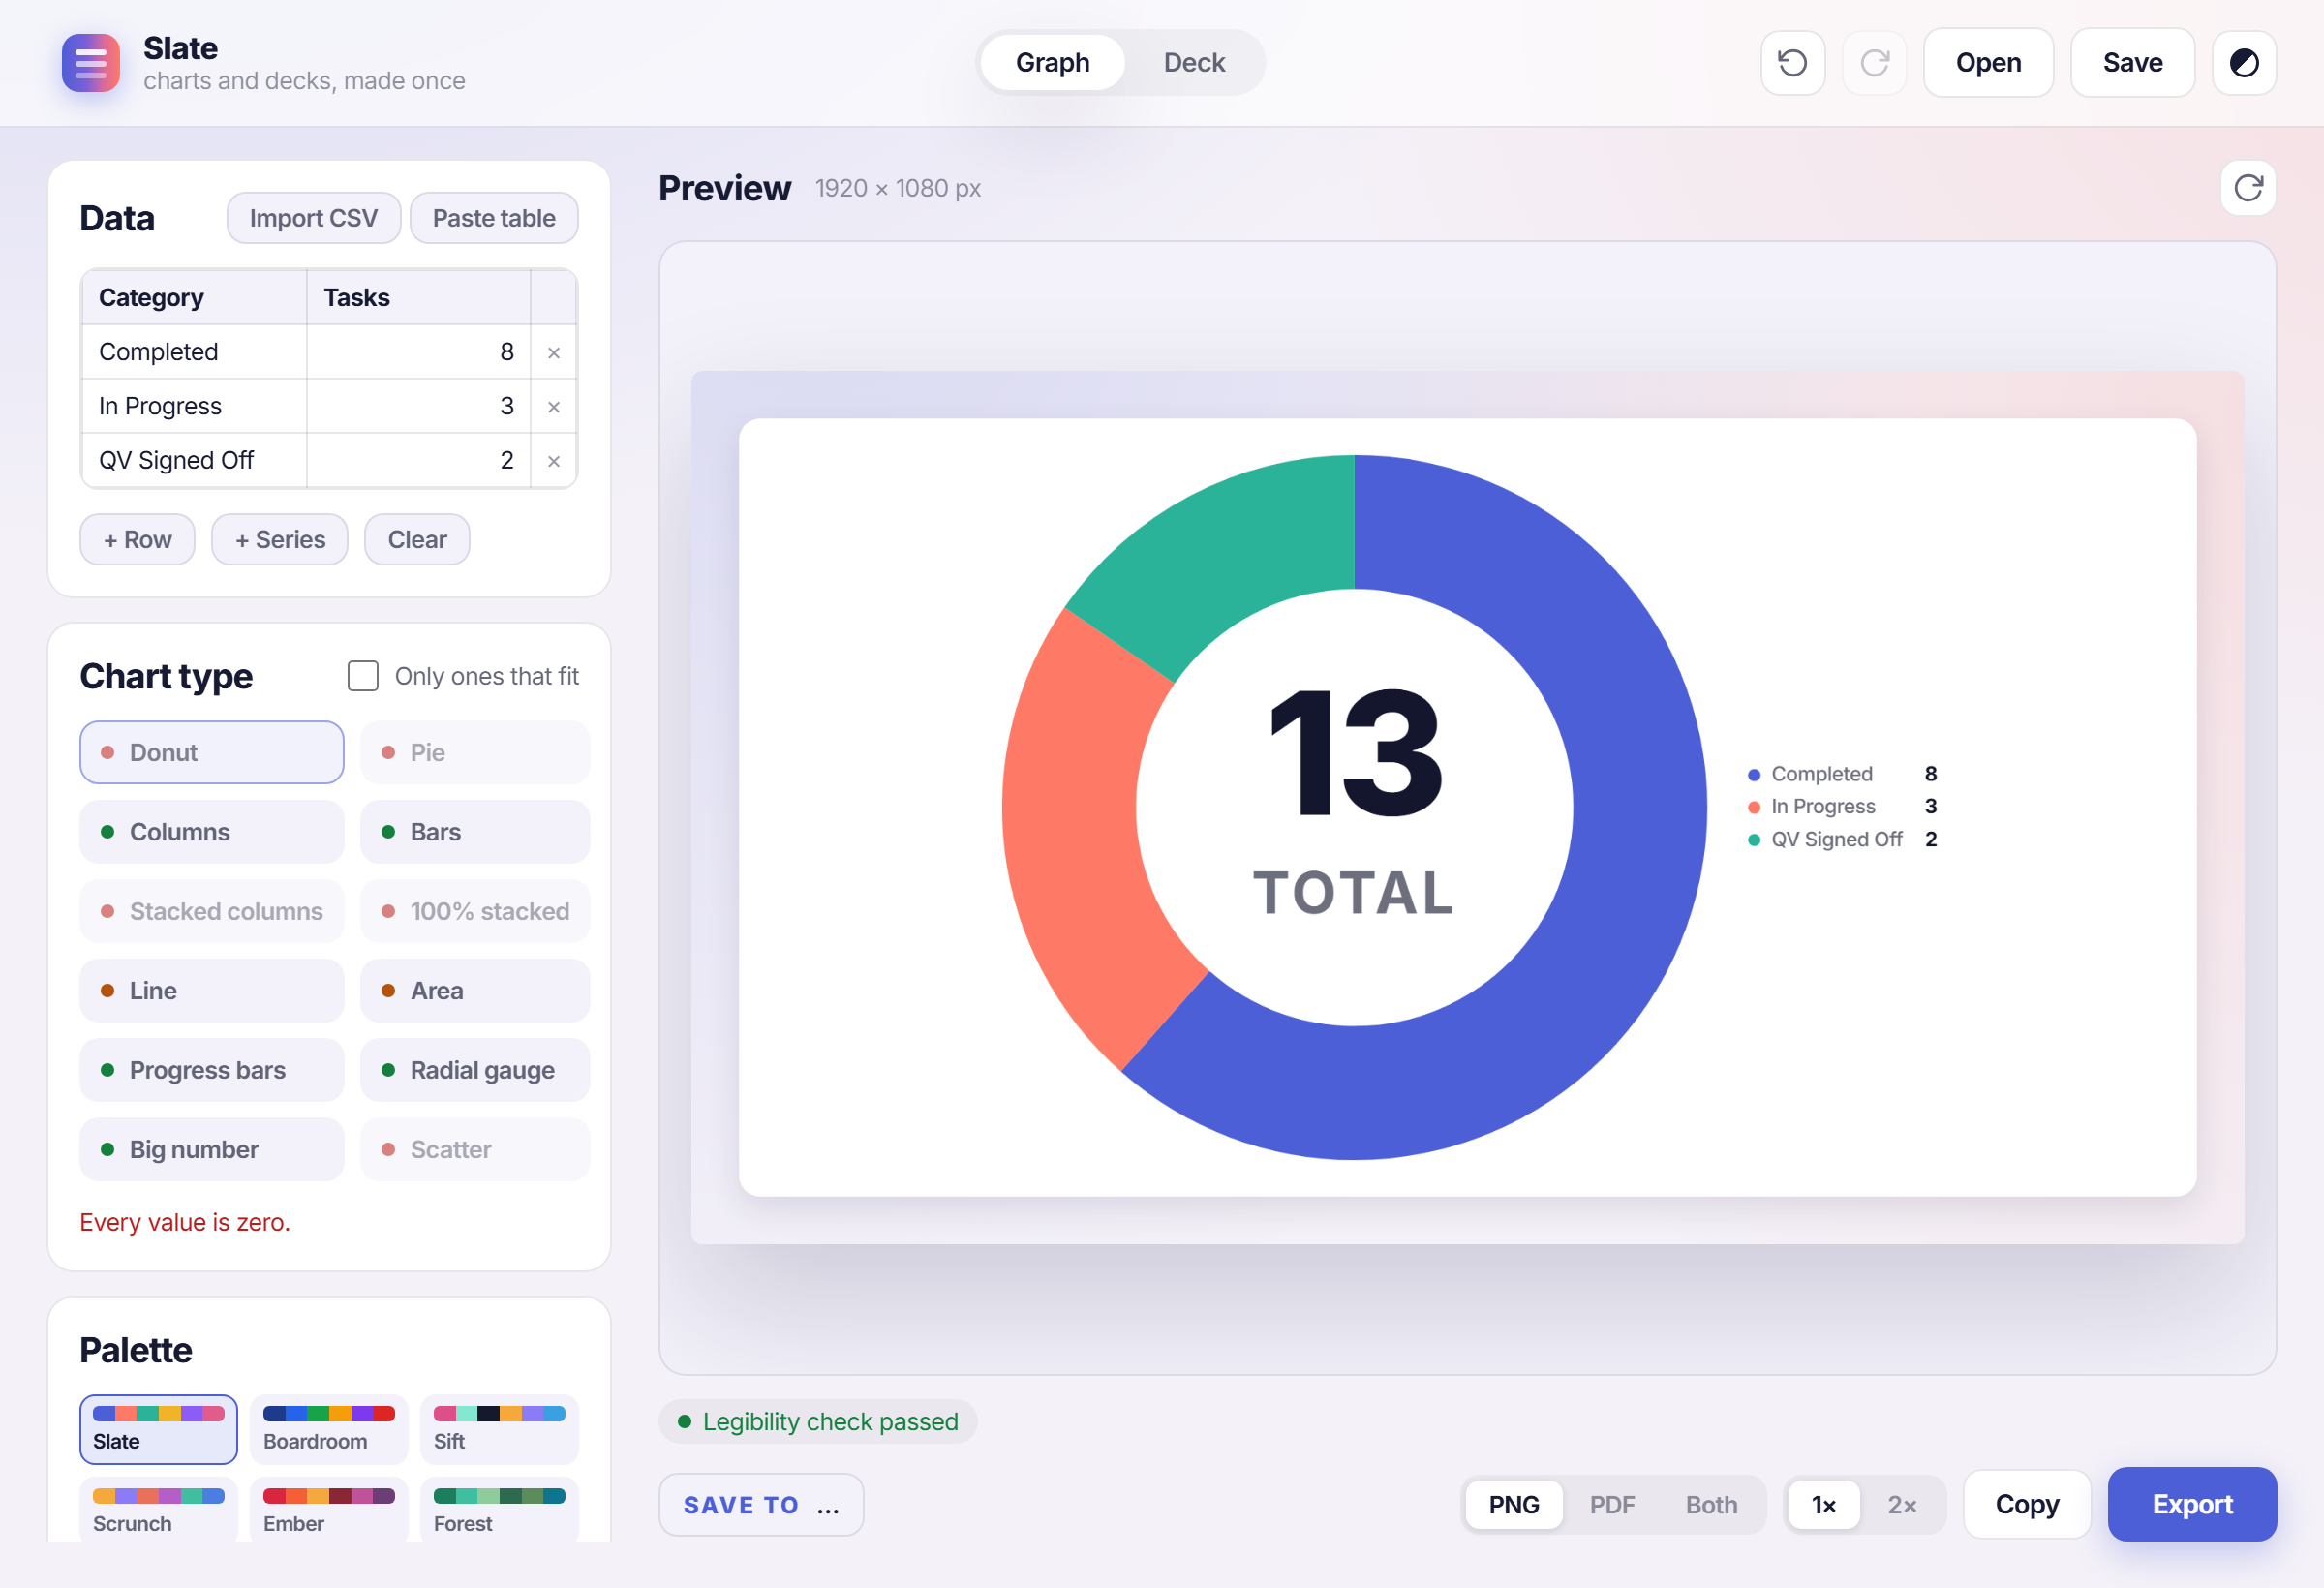
Type in a few rows, or paste a table straight from a spreadsheet, and Slate checks all twelve chart types against your actual data. A pie with two slices gets marked poor. A line chart with no real order to its categories gets marked poor too. You can still pick anything, but you always know which ones are lying to your audience.
Most chart tools will happily draw a pie chart with two slices or a bar chart no one can read the labels on. Nothing stops you until the slide is already in front of a room.
Rough math, not a measurement: trying each chart type by hand in a general slide tool, one at a time, to see which one actually reads clearly, is 15 to 20 minutes of rebuilding the same chart over and over. Slate checks all twelve the moment the data changes and shows a plain fit reading next to each one.
A status update that stays legible.
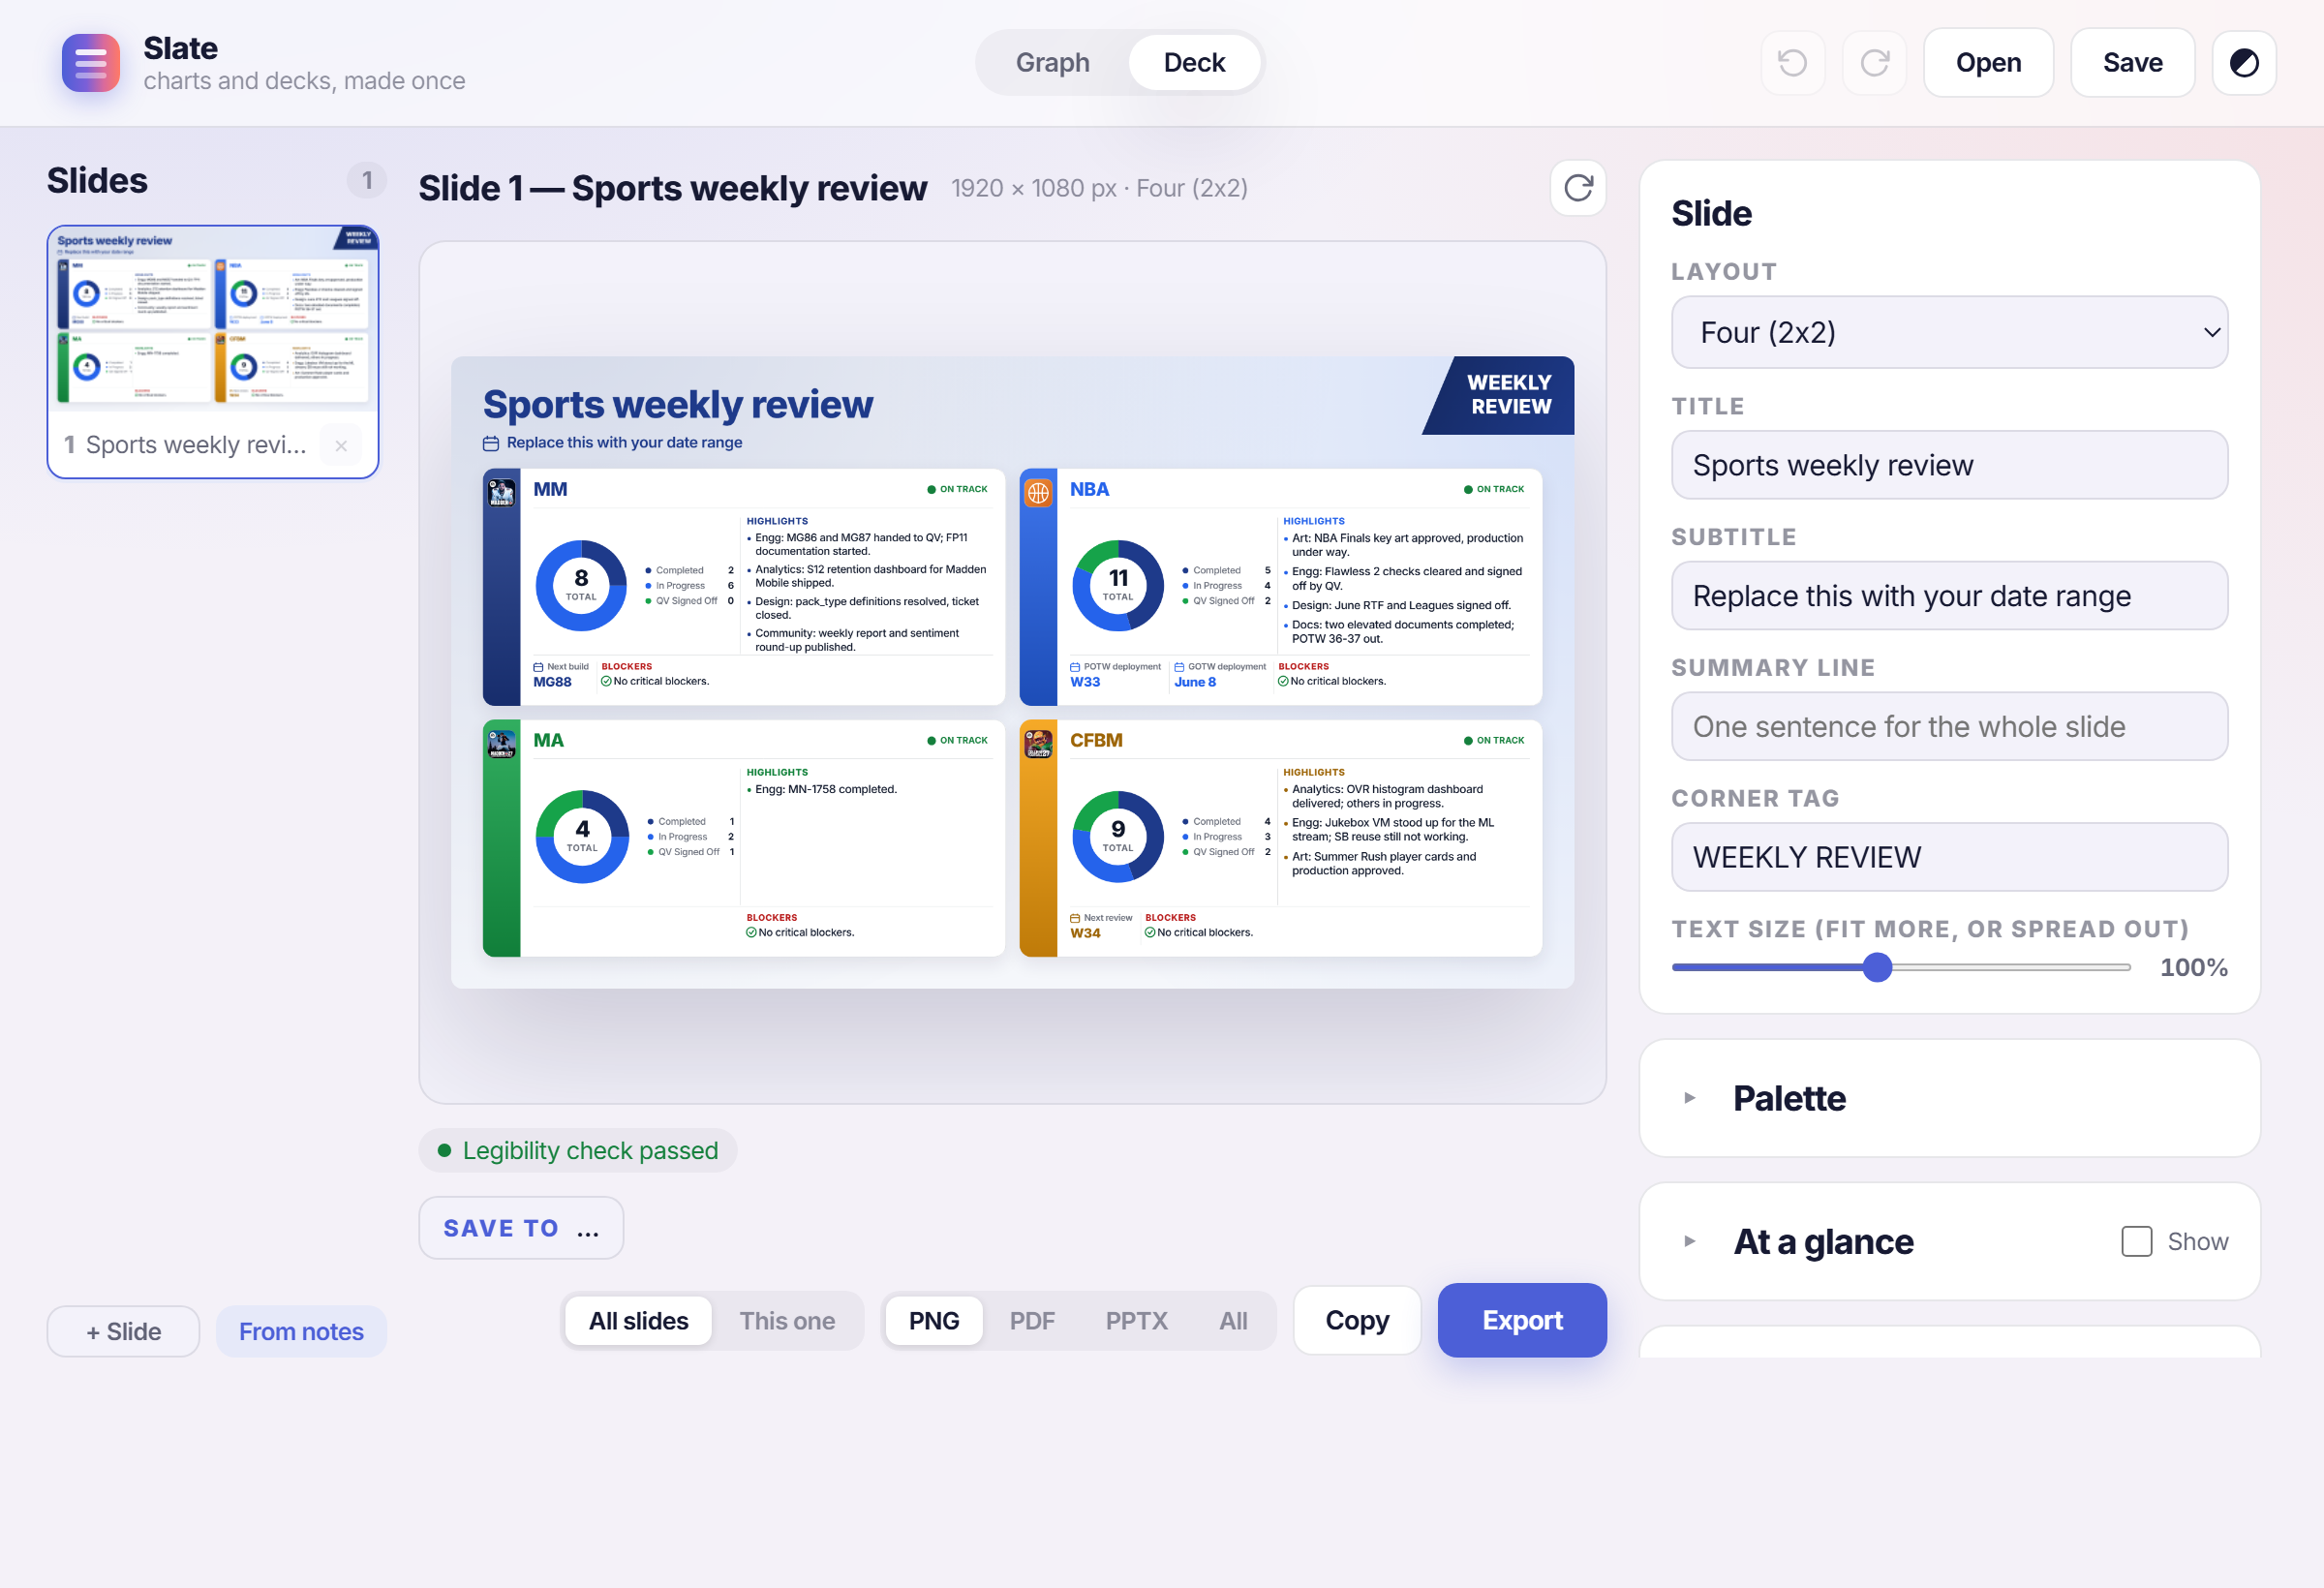
Give each panel a chart, a few highlights, and a note, and Slate lays the whole slide out at a true, fixed resolution. Type never shrinks past a readable floor. When there is genuinely too much to fit, it drops the least important bullet and says so, instead of quietly shrinking everything until no one in the room can read it.
A weekly status deck built by hand means opening last week’s file, hunting for what changed, and manually shrinking text until four panels of updates fit on one slide.
Rough math, not a measurement: building one panel by hand, sizing the chart, wrapping the bullets, and lining up the footer against its neighbours, is several minutes of nudging per panel. On a four-panel slide that is the better part of an hour, every single week. Slate lays out all four from the same data in one pass.